Showing posts with label statistics. Show all posts

Tuesday, November 1, 2022

Holt Double Exponential Smoothing

Given a time series $x_t,\, t=1,2,\dots,$ presumed to contain linear trend, Holt's double exponential smoothing method computes estimates $s_t$ of the level (mean) at time $t$ and $b_t$ of the (presumed constant) slope using the following formulas: $$s_t = \alpha x_t + (1-\alpha)(s_{t-1} + b_{t-1})$$ and $$b_t = \beta(s_t - s_{t-1}) + (1-\beta)b_{t-1}$$ where $\alpha,\beta \in (0,1)$ are smoothing weights. A recent question on OR Stack Exchange asked why the second formula is based on the level estimate and not the observed value. In other words, the proposed alternative to the trend update was $$b_t = \beta(x_t - x_{t-1}) + (1-\beta)b_{t-1}.$$

The intuition for doing it Holt's way is fairly simple. If exponential smoothing is working as intended (meaning smoothing things), then the difference in level estimates $s_t - s_{t-1}$ should be less variable than the difference in observed values $x_t - x_{t-1}.$ A formal proof probably involves induction arguments, requiring more functioning brain cells than I had available at the time, so I was a bit loose mathematically in my answer on OR SE. Just to confirm the intuition, I did some Monte Carlo simulations in R. The notebook containing the experimental setup, including code, is available here. It requires the dplyr and ggplot2 library packages.

The following plots show confidence intervals over time for the errors in the level and trend estimates using both Holt's formula and what I called the "variant" method. They are from a single experiment (100 independent time series with identical slope and intercept, smoothed both ways), but other trials with different random number seeds and changes to the variability of the noise produced similar results.

plot of confidence intervals for error in level estimates

plot of confidence intervals for error in trend estimates

In both cases, the estimates start out a bit wobbly (and the Holt estimates may actually be a bit noisier), but over time both stabilize. There does not seem to be much difference between the two approaches in how noisy the level estimates are, at least in this run. The Holt estimates may have slightly narrower confidence intervals, but that is not clear, and the difference if any seems pretty small. The Holt trend estimates, however, are considerably less noisy than those of the variant method, supporting the intuitive argument.

Friday, October 16, 2020

Multilogit Fit via LP

 A recent question on OR Stack Exchange has to do with getting an $L_1$ regression fit to some data. (I'm changing notation from the original post very slightly to avoid mixing sub- and super-scripts.) The author starts with $K$ observations $y_1, \dots, y_K$ of the dependent variable and seeks to find $x_{i,k} \ge 0$ ($i=1,\dots,N$, $k=1,\dots,K$) so as to minimize the $L_1$ error $$\sum_{k=1}^K \left|y_k - \sum_{i=1}^N \frac{e^{x_{i,k}}}{\sum_{j=1}^K e^{x_{i,j}}}\right|.$$ The author was looking for a way to linearize the objective function.

The solution I proposed there begins with a change of variables: $$z_{i,k}=\frac{e^{x_{i,k}}}{\sum_{j=1}^K e^{x_{i,j}}}.$$ The $z$ variables are nonnegative and must obey the constraint $$\sum_{k=1}^{K}z_{i, k}=1\quad\forall i=1,\dots,N.$$ With this change of variables, the objective becomes $$\sum_{k=1}^K \left|y_k - \sum_{i=1}^N z_{i,k} \right|.$$ Add nonnegative variables $w_k$ ($k=1,\dots, K$) and the constraints $$-w_k \le y_k - \sum_{i=1}^N z_{i,k} \le w_k \quad \forall k=1,\dots,K,$$ and the objective simplifies to minimizing $\sum_{k=1}^K w_k$, leaving us with an easy linear program to solve.

That leaves us with the problem of getting from the LP solution $z$ back to the original variables $x$. It turns out the transformation from $x$ to $z$ is invariant with respect to the addition of constant offsets. More precisely, for any constants $\lambda_i$ ($i=1,\dots,N$), if we set $$\hat{x}_{i,k}=x_{i,k} + \lambda_i \quad \forall i,k$$ and perform the $x\rightarrow z$ transformation on $\hat{x}$, we get $$\hat{z}_{i,k}=\frac{e^{\lambda_{i}}e^{x_{i,k}}}{\sum_{j=1}^{K}e^{\lambda_{i}}e^{x_{i,j}}}=z_{i,k}\quad\forall i,k.$$ This allows us to convert from $z$ back to $x$ as follows. For each $i$, set $j_0=\textrm{argmin}_j z_{i,j}$ and note that $$\log\left(\frac{z_{i,k}}{z_{i,j_0}}\right) = x_{i,k} - x_{i, j_0}.$$ Given the invariance to constant offsets, we can set $x_{i, j_0} = 0$ and use the log equation to find $x_{i,k}$ for $k \neq j_0$.

Well, almost. I dealt one card off the bottom of the deck. There is nothing stopping the LP solution $z$ from containing zeros, which will automatically be the smallest elements since $z \ge 0$. That means the log equation involves dividing by zero, which has been known to cause black holes to erupt in awkward places. We can fix that with a slight fudge: in the LP model, change $z \ge 0$ to $z \ge \epsilon$ for some small positive $\epsilon$ and hope that the result is not far from optimal.

I tested this with an R notebook. In it, I generated values for $y$ uniformly over $[0, 1]$, fit $x$ using the approach described above, and also fit it using a genetic algorithm for comparison purposes. In my experiment (with dimensions $K=100$, $N=10$), the GA was able to match the LP solution if I gave it enough time. Interestingly, the GA solution was dense (all $x_{i,j} > 0$) while the LP solution was quite sparse (34 of 1,000 values of $x_{i,j}$ were nonzero). As shown in the notebook (which you can download here), the LP solution could be made dense by adding positive amounts $\lambda_i$ as described above, while maintaining the same objective value. I tried to make the GA solution sparse by subtracting $\lambda_i = \min_k x_{i,k}$ from the $i$-th row of $x$. It preserved nonnegativity of $x$ and maintained the same objective value, but reduce density only from 1 to 0.99.

Sunday, June 16, 2019

R v. Python

A couple of days ago, I was having a conversation with someone that touched on the curriculum for a masters program in analytics. One thing that struck me was requirement of one semester each of R and Python programming. On the one hand, I can see a couple of reasons for requiring both: some jobs will require the worker to deal with both kinds of code; and even if you're headed to a job where one of them suffices, you don't know which one it will be while you're in the program. On the other hand, I tend to think that most people can get by nicely with just one or the other (in my case R), if not neither. Also, once you've learned an interpreted language (plus the general concepts of programming), I tend to think you can learn another one on your own if you need it. (This will not, however, get you hired if proficiency in the one you don't know is an up-front requirement.)

I don't really intend to argue the merits of requiring one v. both here, nor the issue of whether a one-semester deep understanding of two languages is as good as a two-semester deep understanding of one language. Purely by coincidence, that conversation was followed by my discovering R vs. Python for Data Science, a point-by-point comparison of the two by Norm Matloff (a computer science professor at UC Davis). If you are interested in data science and trying to decide which one to learn (or which to learn first), I think Matloff's comparison provides some very useful information. With the exception of "Language unity", I'm inclined to agree with his ratings.

Matloff calls language unity a "horrible loss" for R, emphasizing a dichotomy between conventional/traditional R and the so-called "Tidyverse" (which is actually a set of packages). At the same time, he calls the transition form Python 2.7 to 3.x "nothing too elaborate". Personally, I use Tidyverse packages when it suits me and not when it doesn't. There's a bit of work involved in learning each new Tidyverse package, but that's not different from learning any other package. He mentions tibbles and pipes. Since a tibble is a subclass of a data frame, I can (and often do) ignore the differences and just treat them as data frames. As far as pipes go, they're not exactly a Tidyverse creation. The Tidyverse packages load the magrittr package to get pipes, but I think that package predates the Tidyverse, and I use it with "ordinary" R code. Matloff also says that "... the Tidyverse should be considered advanced R, not for beginners." If I were teaching an intro to R course, I think I would introduce the Tidyverse stuff early, because it imposes some consistency on the outputs of R functions that is sorely lacking in base R. (If you've done much programming in R, you've probably had more than a few "why the hell did it do that??" moments, such as getting a vector output when you expected a scalar or vice versa.) Meanwhile, I've seen issues with software that bundled Python scripts (and maybe libraries), for instance because users who came to Python recently and have only ever installed 3.x discover that the bundled scripts require 2.x (or vice versa).

Anyway, that one section aside (where I think Matloff and I can agree to disagree), the comparison is quite cogent, and makes for good reading.

Friday, November 9, 2018

Stepwise Regression Code Revisited

I've added a few more tweaks to the stepwise regression code I published back in 2011. (If you wish, see here for the original post and here for a subsequent update.) The code does stepwise regression using F tests (or, equivalently, p-values of coefficients), which is a bit old fashioned but apparently how it is still taught some places. The latest update supplies default values for the alpha-to-enter and alpha-to-leave values. The default values (0 and 1 respectively) are consistent consistent with forward and backward stepwise. For forward stepwise, you would start with a bare-bones initial model, set your alpha-to-enter, and omit alpha-to-leave. For backward stepwise, you would start with a large initial model, set alpha-to-leave and omit alpha-to-enter. Both are demonstrated in the notebook.

The update also allows you to use the R shortcut of typing "." in a formula (meaning "all variables except the dependent variable"). The "." shortcut only works if you specify the data source as an argument to the function. You cannot use "." while omitting the data argument and relying on having the data source attached. Again, there are demonstrations in the notebook.

The code is free to use under a Creative Commons license. It comes in the form of an R notebook, which both defines the stepwise() function and does some demonstrations. From that web page, you should be able to download the notebook file using the select control labeled "Code" in the upper right corner. You can also get the files from my Git repository. The Git repository also has an issue tracker, although I think you will need to create an account in order to add an issue.

Monday, August 21, 2017

Updated Stepwise Regression Function

Back in 2011, when I was still teaching, I cobbled together some R code to demonstrate stepwise regression using F-tests for variable significance. It was a bit unrefined, not intended for production work, and a few recent comments on that post raised some issues with it. So I've worked up a new and (slightly) improved version of it.

The new version is provided in an R notebook that contains both the stepwise function itself and some demonstration code using it. It does not require an R libraries besides the "base" and "stats" packages. There is at least one butt-ugly hack in it that would keep me from being hired in any sort of programming job, but so far it has passed all the tests I've thrown at it. If you run into issues with it, feel free to use the comment section below to let me know. I'm no longer teaching, though, so be warned that maintenance on this is not my highest priority.

The updated function has a few new features:
  • it returns the final model (as an lm object), which I didn't bother to do in the earlier version;
  • you can specify the initial and full models as either formulas (y~x+z) or strings ("y~x+z"), i.e., quotes are strictly optional; and
  • as with the lm function, it has an optional data = ... argument that allows you to specify a data frame.
There are also a few bug fixes:
  • if you set the alpha-to-enter greater than the alpha-to-leave, which could throw the function into an indefinite loop, the function will now crab at you and return NA
  • if you try to fit a model with more parameters than you have observations, the function will now crab at you and return NA; and
  • the function no longer gets confused (I think) if you happen to pick variable/column names that happen to clash with variable names used inside the function.
As always, the code is provided with a Creative Commons license, as-is, no warranty express or implied, your mileage may vary.

Update (11/09/18): I've tweaked the code to add a few features. See here for a post about the updates.

Tuesday, August 9, 2016

Some R Resources

(Should I have spelled the last word in the title "ResouRces" or "resouRces"? The R community has a bit of a fascination about capitalizing the letter "r" as often as possible.)

Anyway, getting down to business, I thought I'd post links to a few resources related to the R statistical language/system/ecology that I think may be either not terribly well known or perhaps a bit under-appreciated. As I come across new ones (or see comments rubbing my nose in some glaring omission),  I will try to remember to update the list.

In no particular order, here is what I have so far. If anyone sees a better way to organize the list, feel free to suggest it in the comments. Also, do not assume my level of verbosity for any item is an indicator of my judgment of its importance or utility. It's purely random.
CRAN Task Views
Every R user knows CRAN, the Comprehensive R Archive Network, because it is the go-to repository for downloading R packages (and R itself). Perhaps not as well known is that it maintains a collection of task views, curated lists of packages useful for particular categories of tasks (such as clinical trials, econometrics or machine learning). Not all task views are limited to statistics. In particular, the task views for numerical mathematics and optimization are interesting to me. The curators are volunteers, so how complete and up to date a given task view is contains an element of chance. As of this writing, I don't see a task view for simulation. I just mention this in case a reader is looking for something to do with their copious idle time. There is also a package ("ctv") you can apparently use to install task views on your PC, but I have not tried it yet.
R Bloggers
R Bloggers is pretty much what it sounds like: an aggregator for, per their subtitle, "R news and tutorials contributed by (580) R bloggers". Given the 580 sources, you can safely assume I am not keeping up with all the reading. They provide the usual RSS feeds and such should you wish to subscribe.
RStudio webinars
RStudio is of course famous for the eponymous IDE (which I highly recommend), along with the Shiny package for interactive web documents and various other highly useful software (including server versions). They also produce a serious of high quality webinars. You can get on their email list for advanced warning of dates and topics, or drop by their webinar repository after the fact to replay previous webinars (all of which are recorded) and optionally download supporting materials.
The R Podcast
I just came across this podcast series recently. The host/auteur, Eric Nantz, is a statistician with over a decade of experience using R. He starts out with the very basics (what is R and how do I install it) and gradually moves into more advanced topics. Again, you can subscribe by various means (including RSS feed), and all episodes can be replayed from the web site. He also has some screencasts (which I have not yet checked out), and some ancillary materials you can download. Each episode includes a segment where he responds to user feedback (provided by various methods, including voicemail, so that you can hear yourself ask your own question in the next episode). The site lists podcasts in reverse chronological order (which is pretty standard), so if you want to start with episode 1 (or was it 0?) you'll need to do some clicking to get there. My advice is to grab the RSS feed in some aggregator, such as Inoreader, where you can see links to all the episodes in a compact format. One nice feature: Eric provides "show notes" (bullet list of topics), so you know what you're getting. One feature I miss: in the early episodes, he provided the times at which each topic started, which made it easy to skip over stuff I didn't need to hear. That seems to have gone missing in more recent posts.
Beginner's Guide to R
Sharon Machlis wrote this beginner's guide for Computerworld. If you are brand new to R, this is a very good place to start. You might also want to follow Sharon to find other helpful articles relating to R, such as "Great R packages for data import, wrangling & visualization".
Google's R Style Guide
Okay, cards on the table: some people take coding style (and in particular consistency of coding style) quite seriously, and some pay it no attention at all. Also, some people view Google as the center of the digital universe, and some think it is the forerunner to either Big Brother or Skynet (or both). So maybe you will be interested in Google's coding style guide for R, and maybe you won't. At any rate, it's there for the asking.
Gallery of htmlwidgets for R
You can do some really whiz-bang interactive things with R and some form of web publishing (Shiny, RMarkdown, R dashboards, ...). For interactive controls and, particularly, interactive graphics, they generally end up using htmlwidgets, which are Javascript libraries that do much of the interactive stuff in the user's browser, as opposed to on the server. (I hope I got that right.) Anyway, there's a gallery of widgets that you can browse to get ideas for what can be done (and which packages/widgets you need to do them).
Hadley Wickham's Vocabulary page
Hadley Wickham, besides being a data scientist, is one of the most prolific authors of high quality (and highly popular) R packages. His vocabulary page lists some of the commands, functions and packages he considers most essential, grouped by task category. Once you've gotten some experience using R, you might want to consult this page to see if you've missed anything useful to you.
DataScience+
DataScience+ is home to free tutorials (115 as of this writing) relating to R. It should be a go-to location when you are looking to learn more about the uses of R. Tutorials range from the basic (getting started with R) to the somewhat esoteric (random forests, Bayesian regression, ...).
R Packages for Data Access (update 2016-08-13)
This Revolutions blog post contains a list of links to packages that provide tools for accessing online data sources (or simply bundle the data sets themselves).
twotoria (update 2016-08-14)
Anthony Damico has posted a series of two minute video tutorials on many basic to intermediate operations in R. They're well done and (at least to my taste) fairly amusing. Note to non-native English speakers: he keeps them to two minutes by speaking at Warp Factor 5, so good luck.

Tuesday, July 5, 2016

Over- and Underfitting

I just read a nice post by Jean-François Puget, suitable for readers not terribly familiar with the subject, on overfitting in machine learning. I was going to leave a comment mentioning a couple of things, and then decided that with minimal padding I could make it long enough to be a blog post.

I agree with pretty much everything J-F wrote about overfitting. He mentioned cross-validation as a tool for combating the tendency to overfit. It is always advisable to partition your sample into a training set (observations used to compute parameters of a model) and a testing set (used to assess the true accuracy of the model). The rationale is that a trained model tends to look more accurate on the training data than it truly is. In cross-validation, you repeatedly divide the original sample (differently each time), repeating the training and testing.

A related approach, perhaps better suited to "big data" situations, is to split your (presumably large) sample into three subsamples: training, testing and validation. Every model under consideration is trained on the same training set, and then tested on the same testing set. Note that if your model contains a tunable parameter, such as the weight assigned to a regularization term, the same basic model with different (user-chosen) values of the tuning parameter are treated as distinct models for our purposes here. Since the testing data is used to choose among models, the danger of the results on the training set being better than they really are now morphs into the danger that the results on the testing set for the "winning" model being better than they really are. Hence the third (validation) sample is used to get a more reliable estimate of how good the final model really is.

One statement by J-F with which I disagree, based on a combination of things I've read and my experiences teaching statistics to business students, is the following:
Underfitting is quite easy to spot: predictions on train[ing] data aren't great.
My problem with this is that people building machine learning models (or basic regression models, for that matter) frequently enter the process with a predetermined sense of either how accurate the model should be or how accurate they need it to be (to appease journal reviewers or get the boss off their backs). If they don't achieve this desired accuracy, they will decide (consistent with J-F's statement) that predictions "aren't great" and move to a different (most likely more complex or sophisticated) model. In the "big data" era, it's disturbingly easy to throw in more variables, but that was a danger even in the Dark Ages (i.e., when I was teaching).

I recall one team of MBAs working on a class project requiring them to build a predictive model for demand of some product. I gave every team the same time series for the dependent variable and told them to pick whatever predictors they wanted (subject, of course, to availability of data). This particular team came up with a reasonably accurate, reasonably plausible model, but it temporarily lost accuracy on observations from the early 1980s. So they stuck in an indicator variable for whether Ronald Reagan was president of the US, and instantly got better accuracy on the training data. I'm inclined to think this was overfitting, and it was triggered because they thought their model needed to be more accurate than it realistically could be. (It was interesting to hear them explain the role of this variable in class.)

When I taught regression courses, I always started out by describing data as a mix of "pattern" and "noise", with "noise" being a relative concept. I defined it as "stuff you can't currently explain or predict", leaving the door open to some future combination of better models, greater expertise and/or more data turning some of the "noise" into "pattern". Overfitting occurs when your model "predicts" what is actually noise. Underfitting occurs when it claims part of the pattern is noise. The problem is that the noise content of the data is whatever the universe / the economy / Loki decided it would be. The universe does not adjust the noise level of the data based on what predictive accuracy you want or need. So calling a model underfitted just because you fell short of the accuracy you thought you should achieve (or needed to achieve) amounts to underestimating the relative noise content, and is both unreliable and likely to induce you to indulge in overfitting.

Sunday, November 22, 2015

On Statistics, Reporting and Bacon

I've previously ranted about the need for a "journalistic analytics" college major, to help with reporting (and editing) news containing statistical analysis. Today I read an otherwise well written article that inadvertently demonstrates how easy it is for even seasoned reporters to slip up.

The cover story of the November 9 issue of Time magazine, written by Jeffrey Kluger, has the title "Red Meat, Hot Dogs and the War on Delicious". It's main focus is a recent meta-analysis that found links between consumption of meat (and particularly processed meat) and colorectal cancer. As a Time subscriber, I've read quite a few articles by Mr. Kluger, who covers the "science beat" for them, and I have a great deal of respect for his ability to interpret scientific evidence and present it both accurately and interestingly. So I was a bit bemused to encounter the following paragraph (approximately midway through the article):
Figures like that are not always easy to understand and can be more alarming than they need to be. The lifetime risk for developing colorectal cancer is just 5% for men and a little lower for women. A hot dog a day would raise that risk by 18% of the 5%–topping you out at about a 6% overall risk. But that assumes that’s all the red meat you ever eat, and those 1% increments add up fast.
Unless the lifetime risk statistics are for confirmed vegetarians (which I doubt), the rise from 5% to 6% lifetime risk would be caused by one hot dog a day (or equivalent) added to your normal diet. Presuming the morbidity statistics were for US citizens (the core audience for Time, I assume), we can put this in the context of a statistic from an earlier paragraph:
In 2013, the average American consumed more than 71 lb. of beef, lamb, veal and pork ...
I'm pretty sure that 71 lb. per person excludes "turkey bacon" and possibly a few other meats that, while not technically "red meats", were found to contain the same nitrates and nitrites that were associated with cancer risk in the meta-study. So the "normal diet" to which you're adding that incremental hot dog per day (or equivalent, for those of you who don't really want an extra hot dog every day) is not exactly devoid of meat products. Therefore, "[b]ut that assumes that's all the read meat you ever eat" is incorrect. (According to my scale, "those 1% increments add up fast" is indeed accurate.)

I don't want to belabor this, nor to find fault with Mr. Kluger (or his editor and/or fact-checker). It's just evidence that even seasoned reporters can commit an occasional statistical faux pas when the flow of the narrative grips them.

low carb and gluten free salad (bacon)
source: http://www.funniestmemes.com/funny-memes-low-carb-and-gluten-free-salad/

Sunday, October 18, 2015

OLS Oddities

During a couple of the lectures in the Machine Learning MOOC offered by Prof. Andrew Ng of Stanford University, I came across two statements about ordinary least squares linear regression (henceforth OLS) that surprised me. Given that I taught regression for years, I was surprised that I could be surprised (meta-surprised?), but these two facts are not ones you're likely to see in a statistics course.

The first is not too shocking in hindsight. Let $X$ be an $m \times n$ matrix containing $m$ observations of $n$ predictors (including a column of ones if you want a constant term in the model) and let $y$ be an $m \times 1$ vector of observations of the dependent variable. A linear model looks like $$y = Xb + e$$where $b$ is the estimated coefficient vector ($n \times 1$) and $e$ is the vector of residuals ($m \times 1$). By definition OLS computes $b$ to minimize the sum of squared residuals $$J(b) = e^\prime e.$$The so-called normal equations are derived by computing the gradient of $J$ and setting it equal to zero. Assuming $X$ has full column rank, this yields $$b = (X^\prime X)^{-1}X^\prime y.$$ Surprising (to me) fact #1: when dealing with large data sets, you may not want to use the nice, closed form, normal equations to compute $b$. The alternative is an iterative approach, using a nonlinear programming algorithm such as gradient descent, or the conjugate gradient method, or some other alternative. The reason is that $(X^\prime X)^{-1}$ may be computationally expensive to compute when $m$ and particularly $n$ are large. In practice, good statistical software would not invert the matrix anyway; it would do some sort of decomposition (LU, decomposition, whatever) both for efficiency and to head off potential rounding problems. Apparently, though, the comparatively small amount of arithmetic required per iteration of gradient descent (mainly computing $X b$ and $X^\prime e$, which are $O(mn)$ operations) offsets the cost of running a bunch of iterations rather doing a one-and-done solution of a matrix equation.

The bigger surprise, though, had to do with multicollinearity, which occurs when $X$ has less than full column rank. Multicollinearity means $X^\prime X$ is singular and cannot be inverted. It also means the model contains redundant predictors (some predictors are linear combinations of others), and I always gave my students the standard prescription: figure out which predictors were redundant and eliminate them. Other people sometimes recommend a perturbation approach (ridge regression). For that matter, gradient descent should work properly with multicollinear data.

Before continuing, I need to inject a well-established if not necessarily well-known fact about multicollinearity. Whether $X$ is multicollinear or not, there is a unique vector $\hat{y}$ of fitted values that minimizes the sum of squared errors. This is because $\hat{y}$ is the orthogonal projection of $y$ onto the column space of $X$, and the orthogonal project of any vector onto any linear subspace is unique. When $X$ has full rank, $\hat{y} =Xb$ where $b$ is given by the normal equations (and is the unique coefficient vector that generates $\hat{y}$. When $X$ is less than full rank (multicollinear), the optimal fitted values $\hat{y}$ can be obtained from any of an infinite number of coefficient vectors ... but the fits are still uniquely determined.

The big surprise for me: it turns out that you can fit a version of the normal equations using the Moore-Penrose pseudoinverse of $X$. I'd come across the pseudoinverse in some long ago linear algebra or numerical analysis class, filed it away as another mathematical curiosity of no particular use, and forgotten it. Oops.

Let $A$ be the pseudoinverse of $X$ (which always exists, is unique, and has dimensions $n \times m$). Then $\hat{b} = Ay$ yields the correct fitted values $X \hat{b}$. A proof begins with one of the identities true of the pseudoinverse: $$X^\prime = X^\prime X A.$$Now the gradient $\nabla_b J(b)$ works out to $-2X^\prime e$; substitute $y - XAy$ for $e$ and $\hat{b}$ for $b$, and we have \begin{alignat*}{1} \nabla_{b}J(\hat{b}) & =-2X^{\prime}e\\ & =-2X^{\prime}\left(y-X\hat{b}\right)\\ & =-2X^{\prime}\left(y-XAy\right)\\ & =-2X^{\prime}(I-XA)y\\ & =-2\left(X^{\prime}-X^{\prime}XA\right)y. \end{alignat*}Substitute the aforementioned identity for the middle expression and we have $ \nabla_{b}J(\hat{b}) = 0$. So choosing $b=\hat{b}$ minimizes squared errors and thus gives the proper fitted values.

All that said, I would still rather eliminate redundant predictors. That process can be automated, but if you are writing a machine learning algorithm that will chew through potentially large data sets with no human supervision, and you want to use linear (or polynomial) models, I suppose you should at least consider using the entire data set with the pseudoinverse taking care of the multicollinearity.

Tuesday, October 6, 2015

Producing Reproducible R Code

A tip in the Google+ Statistics and R community led me to the reprex package for R. Quoting the author (Professor Jennifer Bryan, University of British Columbia), the purpose of reprex is to
[r]ender reproducible example code to Markdown suitable for use in code-oriented websites, such as StackOverflow.com or GitHub.
Much has been written about the virtues of, and need for, reproducible research. Another key need for reproducibility, one at which this package aims, is when posting questions about code or bug reports. Viewers of those posts need to know exactly what you did and exactly what resulted. The readme text on the package's GitHub home page gives a work flow description and some prescriptive advice, which I think is well worth reading.

I'm all for complete and cogent bug reports/code questions and reproducible research, but I was interested in reprex for another reason: formatting R code for blog posts (such as this one). To date I've been using a third party web site (the Pretty R syntax highlighter) to generate HTML from R code, and I've been quite happy with the results. A simpler process would be nice, though. Additional, while the aforementioned site works great with the code, I'm sometimes not sure how I should format the output.

So I decided to take prerex for a test drive using code from an old post here (Tabulating Prediction Intervals in R). I used just the code from the first part of the post (definition of the model.ctable() function and one invocation of it), a total of 17 lines of source code (including Roxygen comments for the function) leading to a single output table. Using RStudio, my work flow was as follows.
  1. Open a new script file and type/paste the code into it.
  2. Source the file to confirm it works as expected.
  3. Copy the code to the clipboard.
  4. In the console window, run the following two lines.
    library(reprex)
    reprex()
    This runs the code in the clipboard, so be careful not to do anything to modify the clipboard contents between the previous step and this one.
  5. Examine the results in the viewer pane (which automatically opens) to confirm that is as expected.
  6. Open a new R Markdown file, delete the boilerplate RStudio inserts, and paste the contents of the clipboard into it. Along with displaying results in the viewer, the reprex() function also places the R Markdown code for it in the clipboard. Again, be careful not to modify the clipboard contents between step 4 and this one.
  7. Click the "Knit HTML" button and provide a destination file for the HTML output. This opens an HTML source file in RStudio.
  8. Copy the contents of the body tag (excluding the opening and closing body tags and ignoring the pile of stuff in the header) and paste into an HTML document. (Depending on the width of the output, you might want to surround it with a scrolling DIV tag, or hack the CSS you just pasted in to make it scrollable and/or give it a border.)
For this post, I added the following properties to the CSS .main-container style defined by reprex:

  overflow: scroll;
  border-style: groove;
  border-width: 5px;
  padding: 10px;

That created a border and a bit of padding, and told the browser to add scroll bars if needed. Here is how my example turned out:


Summarize a fitted linear model, displaying both coefficient significance and confidence intervals.
@param model an instance of class lm @param level the confidence level (default 0.95)
@return a matrix combining the coefficient summary and confidence intervals
model.ctable <- function(model, level = 0.95) {
  cbind(summary(model)$coefficients, confint(model, level = level))
}
x <- rnorm(20)
y <- rnorm(20)
z <- 6 + 3 * x - 5 * y + rnorm(20)
m <- lm(z ~ x + y)
model.ctable(m, level = 0.9)
#>              Estimate Std. Error   t value     Pr(>|t|)       5 %
#> (Intercept)  6.271961  0.2462757  25.46724 5.584261e-15  5.843539
#> x            2.974000  0.2571237  11.56642 1.763158e-09  2.526706
#> y           -4.951286  0.3260552 -15.18542 2.547338e-11 -5.518494
#>                  95 %
#> (Intercept)  6.700384
#> x            3.421294
#> y           -4.384079


You can see the comments, the code and, at the end, the output (formatted as R comments). It's not perfect. In particular, it would be nice if the Roxygen comments looked like comments and not like text. There's also no syntax highlighting (which is to be expected in an R Markdown document). Still, it's not bad for a blog post, and it confirms the package works (and is easy to use).

I'll close by pointing out that I'm going "off label" by using the package this way. In particular, I'm getting no value from one of the prime virtues of R Markdown: the ability to embed code in a text document such that the code can be easily read but can also be executed by "compiling" the document (not true of an HTML document like this post). For posting code to a forum, though, this looks like a definite keeper.

Saturday, May 30, 2015

Decision Analytics and Teacher Qualifications

Disclaimers:
  • This a post about statistics versus decision analytics, not a prescription for improving the educational system in the United States (or anywhere else, for that matter).
  • tl;dr.

The genesis of today's post is a blog entry I read on Spartan Ideas titled "Is Michigan Turning Away Good Teachers?" (Spartan Ideas is a "metablog", curated by our library, that reposts other blogs by members of the Michigan State University community. The original post can be found here.) The focus of that post is on changes to the certification examination that would-be teachers in Michigan are required to pass. I'll quote a couple of key passages here, but invite you to read the full post to get the entire context:
Research has found that only about 8% of the differences in student achievement can be attributed to teachers and only 3% of that can be attributed to the combined impact of teachers’ certification, ACT/SAT scores, degrees, and experience.
...
Because teachers’ examination scores have been found to be only weak predictors of their impact on student learning, an assessment that has a low pass rate by design may prevent some who would be effective teachers from obtaining a teaching certificate, a concern that is supported by research.
(The link in the quote is a 2002 article in Education Next by Dan Goldhaber, senior research associate at the Urban Institute.)

My first reaction to the "weak" connection between teacher characteristics and learning outcomes is that it sounded like bad news for people on all sides of the current debates about educational reform. On the one hand, to the "blame the teacher" crowd (who like to attribute perceived problems in the public education system to poor or bad teachers, teacher tenure etc.), one might say that if teacher quality explains "only" 8% of variance in learning outcomes, quit picking on them and look elsewhere. On the other hand, to people (often affiliated with teacher unions) pushing for better compensation, better working conditions etc., one might point out that those are generally incentives to recruit and retain better teachers; so if teacher quality explains "only" 8% of variance in learning outcomes, perhaps those dollars are better spent elsewhere (upgrading schools, improving neighborhood economic conditions, ...).

What struck me second about the original post was the use of the phrases "only about" and "weak predictors". This seems to me to relate to a difference between statistics, as it is commonly taught (and used), and what some people now refer to as "decision analytics". In my experience, the primary focus of statistics (and its sibling "data analytics") is to identify patterns and explain things (along with making predictions). That makes measures such as correlation and percentage of dependent variance explained relevant. In contrast, decision analytics emphasizes changing things. Where are we now, where do we want to be, which levers can we pull to help us get there, how much should we pull each, and what will it cost us to do so? That perspective may put more emphasis on measures of location (such as means), and on which input factors provide us "leverage" (in the archimedean sense of the term, not the regression sense), than on measures of dispersion (variance).

It is common, at least in the social sciences, to categorize predictors as "strong" or "weak" according to how much variation in the dependent variable they predict. This is the statistics perspective. I understand the attractiveness of this, particularly when the point of the model is to "explain" what happens in the dependent variable. At the same time, I think this categorization can be a bit dangerous from a decision analytics standpoint.

Fair warning: I'm about to start oversimplifying things, for the sake of clarity (and to reduce how much typing I need to do). Suppose that I have a unidimensional measure $L$ of learning outcomes and a unidimensional measure $T$ of teacher quality. Suppose further that I posit a linear model (since I'm all about simplicity today) of the form $$L = \alpha + \beta T + \epsilon$$with $\epsilon$ the "random noise" component (the aggregation of all things not related to teacher quality). Let's assume that $T$ and $\epsilon$ are independent of each other, which gives me the usual (for regression) decomposition of variances:$$\sigma_L^2 = \beta^2 \sigma_T^2 + \sigma_\epsilon^2.$$From the research cited above, we expect to find $\beta^2 \sigma_T^2$ to be about 8% of $\sigma_L^2$.

Tell a decision analyst that the goal is to "improve learning", and something all the lines of the following questions should arise:
  • How do we measure "learning"? (Assume that's our $L$ here.)
  • What is our goal (achieve the biggest bang on a fixed budget, achieve a fixed target at minimal cost, ...)?
  • Is the goal expressed in terms of mean result, median result, achievement by students at some fractile of the learning distribution (e.g., boost the bottom quartile of $L$ to some level), or something else (e.g., beat those pesky Taiwanese kids on international math tests)? Reducing variance in $L$, or the range of $L$, could be a goal, but I doubt it would be many people's first choice, since a uniform level of mediocrity would achieve it.
  • What are our levers? Teacher quality (our $T$) would seem to be one. Improving other measures of school quality (infrastructure, information technology) might be another. We might also look at improving socioeconomic factors, either at the school (more free lunches or even breakfasts, more after-school activities, more security on the routes to and from the schools) or elsewhere (safer neighborhoods, better food security, more/better jobs, programs to support two-parent households, ...).
  • How much progress toward our goal do we get from feasible changes to each of those levers?
  • What does it cost us to move those levers?
The (presumably regression-based) models in the research cited earlier address the penultimate question, the connection between levers and outcomes. They may not, however, directly address cost/benefit calculations, and focusing on percentage of variance explained may cause our hypothetical decision analyst to focus on the wrong levers. Socioeconomic factors may well account for more variance in learning outcomes than anything else, but the cost of nudging that lever might be enormous and the return on the investment we can afford might be very modest. In contrast, teacher quality might be easier to control, and investing in it might yield more "bang for the buck", despite the seemingly low 8% variance explained tag hung on it.

In my simplified version of the regression model, $\Delta L = \beta \Delta T$. The same ingredients that lead to the estimate of 8% variance explained also allow us to take an educated guess whether $\beta$ is really zero (teacher quality does not impact learning; what we're seeing in the data is a random effect) and to estimate a confidence interval $[\beta_L, \beta_U]$ for $\beta$. Assuming that $\beta_L > 0$, so that we are somewhat confident teacher quality relates positively to learning outcomes, and assuming for convenience that our goals are expressed in terms of mean learning outcome, a decision analyst should focus on identifying ways to increase $T$ (and, in the process, a plausible range of attainable values for $\Delta T$), the benefit of the outcome $\Delta L$ for any attainable $\Delta T$, and the cost of that $\Delta T$.

Stricter teacher certification exams may be a way to increase teacher quality. Assuming that certification requirements do in fact improve teacher quality (which is a separate statistical assessment), and assuming that we do not want to increase class sizes or turn students away (and therefore need to maintain approximately the same size teaching work force), imposing tighter certification standards will likely result in indirect costs (increasing salaries or benefits to attract and retain the better teachers, creating recruiting programs to draw more qualified people into the profession, ...). As with the connection between teacher quality and learning outcomes, the connecting between certification standards and teacher quality may be weak in the statistical sense (small amount of variance explained), but our hypothetical analyst still needs to assess the costs and impacts to see if it is a cost-effective lever to pull.

So, to recap the point I started out intending to make (which may have gotten lost in the above), explaining variance is a useful statistical concept but decision analysis should be more about cost-effective ways to move the mean/median/whatever.

And now I feel that I should take a pledge to avoid the word "assuming" for at least a week ... assuming I can remember to keep the pledge.

Sunday, October 12, 2014

The Reciprocal Normal Distribution

A recent question on OR-Exchange dealt with the reciprocal normal distribution. Specifically, if $k$ is a constant and $X$ is a Gaussian random variable, the distribution of $Y=k/X$ is reciprocal normal. The poster had questions about approximating the distribution of $Y$ with a Gaussian (normal) distribution.

This gave me a reason (excuse?) to tackle something on my to-do list: learning to use Shiny to create an interactive document containing statistical analysis (or at least statistical mumbo-jumbo). I won't repeat the full discussion here, but instead will link the Shiny document I created. It lets you tweak settings for an example of a reciprocal normal variable and judge for yourself how well various normal approximations fit. I'll just make a few short observations here:
  • No way does $Y$ actually have a normal distribution.
  • Dividing by $X$ suggests that you probably should be using a distribution with finite tails (e.g., a truncated normal distribution) for $X$. In particular, the original question had $X$ being speed of something, $k$ being (fixed) distance to travel and $Y$ being travel time. Unless the driver is fond of randomly jamming the gear shift into reverse, chances are $X$ should be nonnegative; and unless this vehicle wants to break all laws of physics, $X$ probably should have a finite upper bound (check local posted speed limits for suggestions). That said, I yield to the tendency of academics to prefer tractable/well-known approximations (e.g., normal) over realistic ones.
  • The coefficient of variation of $X$ will be a key factor in determining whether approximating the distribution of $Y$ with a normal distribution is "good enough for government work". The smaller the coefficient of variation, the less likely it is that $X$ wanders near zero, where bad things happen. In particular, the less likely it is that $X$ gets anywhere near zero, the less skewness $Y$ suffers.
  • There is no one obvious way to pick parameters (mean and standard deviation) for a normal approximation to $Y$. I've suggested a few in the Shiny application, and you can try them to see their effect.
I'd also like to give a shout-out to the tools I used to generate the interactive document, and to the folks at RStudio.com for providing free hosting at ShinyApps.io. The tool chain was:
  • R (version 3.1.1) to do the computations;
  • R Studio as the IDE for development (highly recommended);
  • R Markdown as the "language" for the document;
  • Shiny to handle the interactive parts;
  • various R packages/tools to generate the final product.
It's obvious that a lot of loving effort (and probably no small amount of swearing) has gone into the development of all those tools.

Friday, September 26, 2014

Should You Trust Your Analytics Model?

The short answer is "no". At least, don't put too much faith in them.
"Remember that all models are wrong; the practical question is how wrong do they have to be to not be useful."  (George E. P. Box)
It's also useful to remember that your model, no matter how sophisticated or how well supported by theory, is calibrated using data that might be a tad suspect.
"The government are very keen on amassing statistics. They collect them, add them, raise them to the nth power, take the cube root and prepare wonderful diagrams. But you must never forget that every one of these figures comes in the first instance from the chowky dar (village watchman in India), who just puts down what he damn pleases."  (Stamp's Law)
All that said, there was a very nice entry recently in the HBR Blog Network, "How to Tell If You Should Trust Your Statistical Models", that is well worth reading. The author is Theodoros Evgeniou, Professor of Decision Sciences and Technology Management at INSEAD. (Tip of the hat to +Aleksandr Blekh for providing the link on Google+.)

Friday, February 28, 2014

Ridge Regression Revisited

I've been neglecting the blog a bit lately, partly because I haven't had much to say and partly because I've been a bit busy with other things. One of the things keeping me occupied is the excellent Statistical Learning course offered by Stanford. (In one of those coming-full-cycle things, now that I'm retired from teaching, I'm going back to my student roots and taking MOOCs in subjects of interest.)

During one of the lectures I learned something new that was both interesting and had the side effect of making me feel old (a job my knees are entirely up to on their own, thank you very much). Ridge regression has apparently been picked up from the scrap heap of statistical history and repurposed.

Stiffness: it's not just for us old people


To explain ridge regression as I originally learned it, let me start by defining the phrase ill-conditioned matrix. Let $A$ be a square matrix (we'll operate over the reals, although I think this works as well for complex matrices) and let $\left\Vert \cdot\right\Vert $ be a consistent matrix norm. The condition number of $A$, assuming that is nonsingular, is $$\kappa = \left\Vert A\vphantom{^{-1}}\right\Vert \left\Vert A^{-1}\right\Vert \ge 1.$$ For singular matrices, $\kappa$ is either undefined or $\infty$, according to your religious preferences.

Somewhat informally, $\kappa$ can be interpreted as a measure of how much rounding errors may be inflated then inverting $A$ (using floating-point arithmetic ... "pure" mathematicians don't commit rounding errors). An ill-conditioned or "stiff" matrix $A$ is non-singular but has a large condition number (the criterion for "large" being rather fuzzy), meaning that rounding errors during the process of inverting (or factoring, or otherwise torturing) $A$ may result in an answer with lots of incorrect digits. Long ago, a graduate school instructor told my class the story of an engineer who had inverted an ill-conditioned matrix, without realizing it was ill-conditioned, using home-brew FORTRAN code. He'd published the inverse in a journal article to four or five decimal places. All the decimal places in most of the coefficients were wrong. So were lots of digits to the left of the decimal points.

Ridge regression then


Here comes the tie-in to regression. Suppose we are trying to fit the model $$y=x'\beta+\epsilon$$(where $\epsilon$ is random noise with mean zero), and we have collected observations $(X,Y)$ with $X$ an $n\times m$ matrix ($n$ = sample size, $m$ = number of predictors). The normal equations tell us that the least squares estimate for $\beta$ is $$b=(X^\prime X)^{-1}X^\prime Y.$$In theory, $X^\prime X$ is nonsingular unless the predictors are perfectly multicollinear. In practice, if $X^\prime X$ is nonsingular but stiff, our coefficient estimate $b$ can suffer drastic rounding errors. To mitigate those errors, ridge regression tampers with $X^\prime X$, adding a small positive multiple of the identity matrix of dimension $m$. The modified normal equations are$$b_\lambda=(X^\prime X + \lambda I)^{-1}X^\prime Y.$$The result $b_\lambda$ is a deliberately biased estimate of $\beta$, in which we trade the bias for reduced rounding error. We generally choose $\lambda > 0$ as small as possible subject to the need to stabilize the numerics.

When I first encountered ridge regression, we were in the (first) mainframe era. Machine words were small, single-precision arithmetic ruled the computing universe, and rounding errors were relatively easy to generate. Somewhere along the way, computing hardware got smaller and cheaper, double precision arithmetic became the norm and separate floating point units took over the computational load. At the same time, matrix factorization replaced matrix inversion, and factoring algorithms got smarter about managing rounding error. The problems with stiff $X^\prime X$ matrices seemed largely to disappear, and references to ridge regression became uncommon, at least in my experience.

Ridge regression now


In the Statistical Learning course, ridge regression makes a resurgence, with an entirely different purpose. In the era of Big Data, there is a distinct danger that we may overfit data by throwing in lots and lots of predictors (large dimension $m$). One way to mitigate that temptation is to penalize the number or size of the coefficients in the model.

The normal equations minimize the sum of squared deviations in a linear regression model. In other words, the ordinary least squares estimate of $\beta$ solves the problem$$\min_b \Vert Y-X b\Vert^2.$$Given that we are squaring errors, and given that quadratic objective functions have nice smoothness, a tempting way to penalize overfitting is to add a penalty for the size of the coefficient vector:$$\min_b \Vert Y-X b\Vert^2 + \lambda \Vert b \Vert^2$$where $\lambda > 0$ is a penalty parameter. If $\lambda = 0$, we are back to ordinary least squares. As $\lambda \rightarrow \infty$, $\Vert b \Vert$ will converge toward (but never quite reach) 0.

I'll skip the algebra and just state that solving this problem for fixed $\lambda$ is mathematically equivalent to ridge regression as seen above. The only difference is in the choice of $\lambda$. When we were fighting rounding error, we wanted the smallest $\lambda$ that would clean up most of the rounding error. Now, when we are fighting overfitting, we probably need larger values of $\lambda$ to get the job done.

So everything old is new again ... which bodes well for my knees.

Thursday, January 23, 2014

Histogram Abuse

Consider the following Trellis display of histograms of a response variable ($Z$), conditioned on two factors $(X, Y)$ that can each be low, medium or high:
The combined sample size for the nine plots is 10,000 observations. Would you agree with the following assessments?

  • $Z$ seems to be normally distributed for medium values of either $X$ or $Y$ (or both).
  • $Z$ appears to be negatively skewed when both $X$ and $Y$ are low (and perhaps when $X$ is low and $Y$ is high), and perhaps positively skewed when both $X$ and $Y$ are high.
  • $Z$ appears to be leptokurtic when both $X$ and $Y$ are low.

What motivated this post is a video I recently watched, in which the presenter generated a matrix of conditional histograms similar to this one. In fairness to the presenter (whom I shall not name), the purpose of the video was to show how to code plots like this one, not to do actual statistical analysis. In presenting the end result, he made some off-hand remarks about distributional differences of the response variable across various values of the covariates. Those remarks caused my brain to itch.

So, are my bulleted statements correct? Only the first one, and that only partially. (The reference to $Y$ is spurious.) In actuality, $Z$ is independent of $Y$, and its conditional distribution given any value of $X$ is normal (mesokurtic, no skew). More precisely, $Z=2X+U$ where $U\sim N(0,1)$ is independent of both $X$ and $Y$. The data is simulated, so I can say this with some assurance.

If you bought into any of the bulleted statements (including the "either-or" in the first one), where did you go wrong? It's tempting to blame the software's choice of endpoints for the bars in the histograms, since it's well known that changing the endpoints in a histogram can significantly alter its appearance, but that may be a bit facile. I used the lattice package in R to generate the plot (and those below), and I imagine some effort went into the coding of the default endpoint choices in the histogram() function. Here are other things to ponder.

Drawing something does not make it real.


The presence of $Y$ in the plots tempts one to assume that it is related to $Z$, even without sufficient context to justify that assumption.

Sample size matters.


The first thing that made my brain itch, when I watched the aforementioned video, was that I did not know how the covariates related to each other. That may affect the histograms, particularly in terms of sample size.

It is common knowledge that the accuracy of histograms (and pretty much everything else statistical) improves when sample size increases. The kicker here is that we should ask about the sample sizes of the individual plots. It turns out that $X$ and $Y$ are fairly strongly correlated (because I made them so). We have 10,000 observations stretched across nine histograms. An average of over 1,000 observations per histogram should be enough to get reasonable accuracy, but we do not actually have 1,000 data points in every histogram. The scatter plot of the original covariates (before turning them into low/medium/high factors) is instructive.
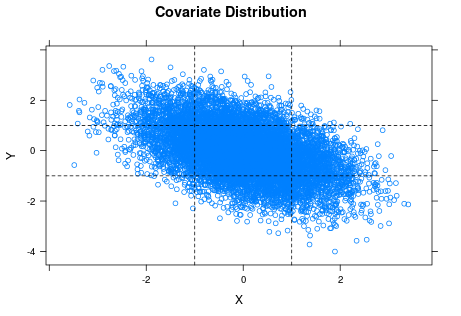
The horizontal and vertical lines are the cuts for classifying $X$ and $Y$ as low, medium or high. You can see the strong negative correlation between $X$ and $Y$ in the plot. If you look at the lower left and upper right rectangles, you can also see that the samples for the corresponding two histograms of $Z$ ($X$ and $Y$ both low or both high) are pretty thin, which suggests we should not trust those histograms so much.

Factors often hide variation (in arbitrary ways).


In some cases, factors represent something inherently discrete (such as gender), but in other cases they are used to categorize (pool) values of a more granular variable. In this case, I cut the original numeric covariates into factors using the intervals $(-\infty, -1]$, $(-1, +1]$ and $(+1, +\infty)$. Since both covariates are standard normal, that should put approximately 2/3 of the observations of each in the "medium" category, with approximately 1/6 each in "low" and "high".

To generate the plot matrix, I must convert $X$ and $Y$ to factors; I cannot produce a histogram for each individual value of $X$ (let alone each combination of $X$ and $Y$). Even if my sample were large enough that each histogram had sufficiently many points, the reader would drown in that many plots. Using factors, however, means implicitly treating $X=-0.7$ and $X=+0.3$ as the same ("medium") when it comes to $Z$. This leads to the next issue (my second "brain itch" when viewing the video).

Mixing distributions blurs things.


As noted above, in the original lattice of histograms I am treating the conditional distributions of $Z$ for all $(X, Y)$ values in a particular category as identical, which they are not. When you mix observations from different distributions, even if they come from the same family (normal in this case) and have only modestly different parameterizations, you end up with a histogram of a steaming mess. Here the conditional distribution of $Z$ given $X=x$ is $N(2x, 1)$, so means are close if $X$ values are close and standard deviations are constant. Nonetheless, I have no particular reason to expect a sample of $Z$ when $X$ varies between $-1$ and $+1$ to be normal, let alone a sample where $X$ varies between $-\infty$ and $-1$.

To illustrate this point, let me shift gears a bit. Here is a matrix of histograms from samples of nine variables $X_1,\dots,X_9$ where $X_k \sim N(k, 1)$.
Each sample has size 100. I have superimposed the normal density function on each plot. I would say that every one of the subsamples looks plausibly normal.

Now suppose that there is actually a single variable $X$ whose distribution depends on which of the nine values of $k$ is chosen. In order to discuss the marginal distribution of $X$, I'll assume that an arbitrary observation comes from a random choice of $k$. (Trying to define "marginal distribution" when the distribution is conditioned on something deterministic is a misadventure for another day.) As an example, $k$ might represent one of nine possible categories for undergraduate major, and $X$ might be average annual salary over an individual's working career.

Let's see what happens when I dump the 900 observations into a single sample and produce a histogram.
The wobbly black curve is a sample estimate of the density function, and the red curve is the normal density with mean and standard deviation equaling those of the sample (i.e., $\mu=\bar{X}, \sigma=S_X$). To me, the sample distribution looks reasonably symmetric but too platykurtic (wide, flat) to be normal ... which is fine, because I don't think the marginal distribution of $X$ is likely to be normal. It will be some convolution of the conditional distribution of $X$ given $k$ (normal, with mean $k$) with the probability distribution for $k$ ... in other words, a steaming mess.

When we pool observations of $X$ from different values of $k$, we are in effect mixing apples and oranges. This is what I meant by "blurring" things. The same thing went on in the original plot matrix, where we treated values of $Z$ coming from different distributions (different values of $X$ in a single category, such as "medium") as being from a common distribution.

So what is the takeaway here?


In Empirical Model Building and Response Surfaces (Box and Draper, 1987), the following quote appears, usually attributed to George E. P. Box: "Essentially, all models are wrong, but some are useful." I think that the same can be said about statistical graphs, but perhaps should be worded more strongly. Besides visual appeal, graphics often make the viewer feel that they are what they are seeing is credible (particularly if the images are well-organized and of good quality) and easy to understand. The seductive feeling that you are seeing something "obvious" makes them dangerous.

Anyone who is curious (or suspicious) is welcome to download my R code.

Sunday, December 1, 2013

Testing Regression Significance in R

I've come to like R quite a bit for statistical computing, even though as a language it can be rather quirky. (Case in point: The anova() function compares two or more models using analysis of variance; if you want to fit an ANOVA model, you need to use the aov() function.) I don't use it that often, though, which is a mixed blessing. The bad new is that infrequent use makes it hard for me to remember everything I've learned about the language. The good news is that infrequent use means I'm not having to do statistical analysis very often.

I don't think I'm alone in believing that consistent coding patterns (paradigms, idioms, whatever you want to call them) are very helpful when using a language infrequently. That motivates today's post, on testing significance of a regression model. By model significance, I mean (in somewhat loose terms) testing
H0: the null model (no predictors other than a constant term) fits the data at least as well as our model
versus
H1: our model fits the data better than the null model.
When performing a standard linear regression, the usual test of model significance is an F-test. As with most (all?) statistics packages, R helpfully prints out the p-value for this test in the summary output of the regression, so you can see whether your model is (literally) better than nothing without any extra work. To test whether a second model (call it model2) improves on model 1 significantly, you use the anova() command:
anova(model1, model2)

which is easy enough to remember.

When performing a generalized linear regression, however, R does not automatically give you a model significance test. I'll focus here on a binary logit model (dependent variable binary), but I'm pretty sure the various approaches apply to other uses of the GLM, perhaps with some tweaks.

Let's say that model1 is a binary logistic regression model I've fitted in R. The most common test for significance of a binary logistic model is a chi-square test, based on the change in deviance when you add your predictors to the null model. R will automatically calculate the deviance for both your model and the null model when you run the glm() command to fit the model. The approach to testing significance that I've seen on a number of web pages, including this one, involves calculating the p-value manually, using some variation of the following syntax:
with(model1, pchisq(null.deviance - deviance, df.null - df.residual, lower.tail = FALSE))

That's fine (nice and compact), but prospects of my remembering it are slender at best. Fortunately, we can use the aforementioned anova() command by manually fitting the null model. First rerun the logistic regression using just a constant term. Call the resulting fit null.model. Now compare null.model to model1 using the anova() command, adding an argument to tell R that you want a chi-square test rather than the default F test:
anova(null.model, model1, test = "Chisquare")
You can also use the same syntax to compare two fitted logistic models for the same data, say where model2 adds some predictors to model1. For me, that's a lot easier to remember than the manual approach.

Here's some heavily annotated code (or you can download it), if you want to see an example:

#
# Linear and logit regression examples.
#
# (c) 2013 Paul A. Rubin
# Released under the <a href="http://creativecommons.org/licenses/by/3.0/deed.en_US">Creative Commons Attribution 3.0 Unported License</a>.
#
library(datasets);
#
# To demonstrate linear regression, we use the ChickWeight data set.
# Dependent variable:
#   weight = the weight (grams) of a chick.
# Predictors:
#   Time = age of the chick (days)
#   Diet = factor indicating which of four diets was fed to the chick
# Not used:
#   Chick = subject identifier
#
# First model: regress weight on just age.
#
model1 <- lm(weight ~ Time, data = ChickWeight);
summary(model1);
#
# Shocking discovery: weight increases with age!
#
# Second model: regress weight on both age and diet.
#
model2 <- lm(weight ~ Time + Diet, data = ChickWeight);
summary(model2);
#
# Diet is also significant, and diets 2-4 all apparently have
# different effect on weight gain from diet 1.
#
# Is model 2 better than the "null" model (constant term only)?
# The summary output includes the approximate p-value (< 2.2e-16, 
# so essentially zero) for an F-test comparing model 2 to the null
# model. We can get the same information as follows:
#
null.model <- lm(weight ~ 1, data = ChickWeight); # actual null model
summary(null.model);
anova(null.model, model2); # compare model 2 to null model
#
# Is model 2 significantly better than model 1?
#
anova(model1, model2); # yes (p < 2.2e-16 again)
#
# We now switch to logit regression. To demonstrate it, we create
# a new 0-1 variable indicating whether a chick is heavier than
# 170 grams (1) or not (0), and append it to the data set.
#
ChickWeight <- cbind(ChickWeight, chubby = ChickWeight$weight > 170);
#
# Next, we run a logit model to see if age and diet predict whether
# a chick is chubby.
#
model3 <- glm(chubby ~ Time + Diet, data = ChickWeight, family = "binomial");
summary(model3);
# All terms except Diet2 seem significant (suggest that diets 1 and
# 2 may have the same tendency to create chubby chicks, while diets
# 3 and 4 are more inclined to do so, since their coefficients are
# positive).
#
# Now we add interactions.
#
model4 <- glm(chubby ~ Time*Diet, data = ChickWeight, family = "binomial");
summary(model4);
#
# Main effects of diet are not longer significant, but somewhat oddly
# the interaction of time with diet 4 is.
#
# We use a chi-square test to test for overall model significance,
# analogous to the F test for a linear regression. The catch is
# that R does not provide a significance value in the summary output
# for the glm method. We can compute a p-value manually, as follows.
#
with(model3, pchisq(null.deviance - deviance, df.null - df.residual, lower.tail = FALSE));
#
# The p-value is essentially zero, so we reject the null and conclude
# that model 3 is better than nothing.
#
# Manual computation may be faster on large data sets (the deviances
# have already been calculated), but it is arguably easier (at least
# on the user's memory) to generate the null model (as before) and then
# run an ANOVA to compare the two models.
#
null.model <- glm(chubby ~ 1, data = ChickWeight, family = "binomial");
anova(null.model, model3, test = "Chisq");
#
# The chi-square test has a bit less precision (p < 2.2e-16 rather than
# p = 7e-69), but that precision is probably spurious (the weight data
# is not accruate to 69 decimal places). We still reject the null
# hypothesis that the null model is at least as good as model3 at
# predicting chubbiness. To test whether the model with interaction terms is
# better than the model without them, we can again run an ANOVA.
#
anova(model3, model4, test = "Chisq");
#
# The p-value (0.03568) suggests that we should again reject the
# null hypothesis (that first model is at least as good as the
# second model) and conclude that inclusion of the interaction terms
# improves prediction (although the significant interaction with
# no significant main effect for diet is rather suspicious).
#
# One other way to test significance of a logit model is to run
# an ANOVA with the model as the sole argument.
#
anova(model3, test = "Chisq");
#
# R adds terms to the model sequentially and shows the significance
# of each change (using a chi square test). If any of the terms
# are significant, the model is better than the null model. In
# the output of the previous command, the Time variable is very
# significant (p < 2.2e-16), so the null hypothesis that our model
# is no better than the null model is rejected even before we see
# the results for adding Diet (again significant).
Created by Pretty R at inside-R.org