Wednesday, April 28, 2021

A BDD with JGraphT

Decision diagrams, and in particular binary decision diagrams (BDDs) [1], were originally introduced in computer science to evaluate logic propositions or boolean functions. Lately, they've taken on multiple roles in discrete optimization [2]. I've been reading an excellent book [3] on them, with ideas about using BDDs in a current research project. As is my wont, I'll be coding the research in Java, so I wanted to do a little demo project to figure out how to build and process a BDD in Java.

Not wanting to reinvent any wheels, I looked for an open-source Java graph library with which to build the diagrams, and settled on JGraphT [4]. Not only does JGraphT have the necessary building blocks, it has much better online documentation than many libraries. Also, there is a very helpful article [5] about it on the Baeldung web site (which is itself an extremely useful site for all things Java).

A BDD is a directed, acyclic, layered multigraph with edge weights. If you're not familiar with the term "multigraph", it means that there can be two or more distinct edges between the same pair of nodes, in the same direction. In a BDD, each node represents a state of the system, with up to two outbound arcs, corresponding to true (1) or false (0) values for a particular decision variable. The decision variable is the same for all nodes in a particular layer. An arc is omitted if it represents a decision which, given the state, would make the solution infeasible. To keep the size of the BDD in check (somewhat), you do not want multiple nodes in a layer with the same state. The multigraph aspect arises because, in some circumstances, the next state may be the same regardless of the decision at the current node (so both arcs go to the same child node). Among the attractions of the JGraphT library are its support for nodes based on arbitrary classes (which in a BDD means the state at the node) and for multigraphs.

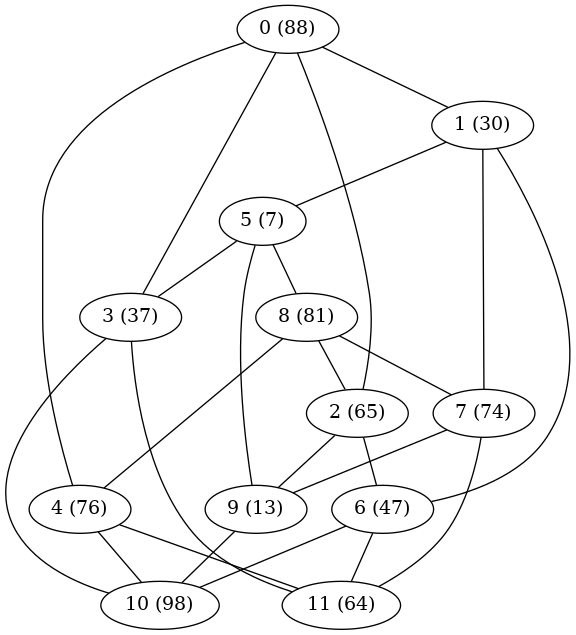
To learn how to build BDDs with JGraphT, I decided to solve a maximal independent set problem (MISP) [6] with integer node weights. This means choosing the subset of nodes with greatest total weight such that no two chosen nodes are adjacent. JGraphT contains routines to generate some well-known (to graph theorists -- less well known to me) graphs, and for convenience I chose the Chvátal graph [7], which has 12 nodes and 24 edges. Here is an illustration of the Chvátal graph, with the (randomly generated) node weights in parentheses.

Chvatal graph
My Java program uses routines in the JGraphT library to turn the graph into a DOT file [8], which it saves. I then use GraphViz [9] outside the Java program to convert the DOT file into the format I need for wherever the plot is going.

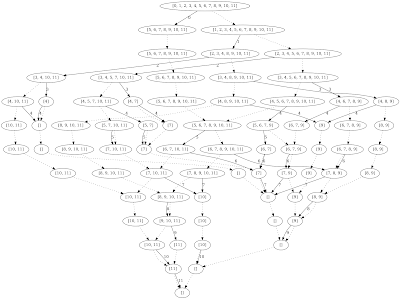
Using the same DOT export trick, I managed to generate a plot of the BDD, in which nodes display the set of vertices still available for addition to the independent set, arcs are solid if a vertex is being added to the independent and dotted if not, and solid arcs are annotated with the number of the vertex being added.

BDD graph
Unfortunately, Blogger does not accept SVG images and the BDD is a bit too big for a legible PNG graph. If you want to see a better image, click it and an SVG version should open in a new window or tab.

This post is already a bit long, so I won't go into details about the various coding issues I ran into or how I worked around them. I will point out one minor mathematical issue. Since the MISP is a maximization problem, the goal is to find the longest (in terms of weight, not number of edges) path from root node to terminal node in the BDD. JGraphT has a package containing shortest path algorithms, but no longest path algorithms. Fortunately, the number of layers in the graph is fixed (one layer per decision variable, plus one to hold the terminal node), which means the number $L$ of links in a longest path is fixed. So we simply find the maximum weight $W$ of any node in the graph, change the weight $w_e$ of each edge $e$ to $LW - w_e$, and find the shortest path using the modified weights. That path is guaranteed to be the longest path with respect to the original weights.

Last thing: As usual, my code is available for you to play with from my GitLab repository.
References

[1] Wikipedia entry: Binary decision diagram
[3] Bergman, D.; Cire, A. A.; van Hoeve, W.-J. & Hooker, J. Decision Diagrams for Optimization. Springer International Publishing AG, 2016.
[4] JGraphT library
[6] Wikipedia entry: Maximal independent set
[7] Wikipedia entry: Chvátal graph
[9] Graphviz - Graph Visualization Software

Wednesday, April 21, 2021

Lagrangean Relaxation: The Sequel

In a previous post, I looked at a way to solve a multiple assignment problem (where multiple users can be assigned to each server and each user can be assigned to multiple servers) using Lagrangean relaxation (LR). I won't repeat the details of the problem, or why LR was of interest, here. The post included some computational experiments in R, using CPLEX to get the optimal solution (for confirmatory purposes) and then trying out various nonlinear optimization algorithms on the Lagrangean function.

I've been looking for an open-source, derivative-free nonlinear optimizer (capable of taking box constraints) in Java, and I came across a couple in the Apache Commons Mathematics Library. Wanting to test one of them out, I repeated the experiment with the assignment problem in Java, again using CPLEX to get the optimal solution, and using the BOBYQA algorithm for minimizing the Lagrangean. As is my habit, I've made my Java code available via a GitLab repository for anyone who might want to see it. The Apache Commons library is a bit funky when it comes to using the optimization classes, so I had to do a little trial and error (and considerable staring at the Javadocs), along with a web search for examples. Hopefully my code is simple enough to be easy to digest.


Monday, April 12, 2021

A Math Puzzle as a Network

There is a standard type of math puzzle that has been around at least since I was a child. The details vary, but the concept is consistent. You are typically given a few initially empty containers of various (integer) capacities, an essentially infinite reservoir of something that goes in the containers, and a goal (integer) for how much of that something you want to end up with. You have to figure out how to reach the goal without having any measuring instruments, meaning that your operations are limited to emptying a container into the reservoir, filling a container from the reservoir, or moving content from one container to another until you empty the source or fill the destination, whichever happens first. (All this is done under the assumption of no spillage, meaning the originator of the puzzle did not have me in mind.) I think I've seen a variant that involves cutting things, where your ability to measure where to cut is limited to stacking pieces you already have as a guide to the piece you want to cut.

A question popped up on Mathematics Stack Exchange about how to solve one of these puzzles using dynamic programming (DP) with backward recursion. The problem at hand involves two jugs, of capacities seven and three liters respectively, and a lake, with the desired end state being possession of exactly five liters of water. The obvious (at least to me) state space for DP would be the volume of water in each jug, resulting in 32 possible states ($\lbrace 0,\dots,7\rbrace \times \lbrace 0,\dots,3 \rbrace$). Assuming the objective function is to reach the state $(5,0)$ with a minimal number of operations, the problem can be cast just as easily as a shortest path problem on a digraph, in which each node is a possible state of the system, each arc has weight 1, and arcs fall into one of the categories mentioned in the previous paragraph.

I was looking for an excuse to try out the igraph package for R, and this was it. In my R notebook, a node label "5|2" would indicate the state where the larger jug contains five liters and the smaller jug contains two. Arcs are labeled with one of the following: "EL" (empty the larger jug); "FL" (fill the larger jug); "ES" (empty the smaller jug); "FS" (fill the smaller jug); "PLS" (pour the larger jug into the smaller jug); or "PSL" (pour the smaller jug into the larger jug).

Assuming I did not screw up the digraph setup, a total of nine operations are required to get the job done. If you are interested, you can see my code (and the solution) in this R notebook.

Thursday, April 8, 2021

A GA Model for a Joint Clustering Problem

A problem in grouping users and servers was posted on Mathematics Stack Exchange and OR Stack Exchange. (Someone remind me to rant about cross-posting in a future blog post. Just don't cross-post the reminder.) The gist of the problem is as follows. We have $S$ servers of some sort, and $U$ users. For each combination of user $u$ and server $s$, we have a parameter $h_{u,s}$ which pertains to the quality / strength / something of service user $u$ would get from server $s$. We are told to group users and servers into a predefined number $G$ of groups or clusters. Every user in cluster $g$ will be served by every server in cluster $g$, but servers in other clusters will interfere with the service to user $u$. (A possible application might be cellular phone service, where signals from towers to which you are not connected might interfere with your signal. Just guessing.)

There is one more parameter, the maximum number ($M$) of servers that can be assigned to a group. It is explicitly stated that there is no limit to the number of users that can be assigned to a group. I'm going to go a step further and assume that every group must contain at least one server but that there is no lower limit to the number of users assigned to a group. (If a group has no users, presumably the servers in that group get to relax and play video games or whatever.)

The objective is to maximize $\sum_{u=1}^U q_u$, the total quality of service, where $q_u$ is the quality of service for user $u$. What makes the problem a bit interesting is that $q_u$ is a nonlinear function of the allocation decisions. Specifically, if we let $\mathcal{S}_1, \dots, \mathcal{S}_G$ be the partition of the set $\mathcal{S} = \lbrace 1,\dots, S\rbrace$ of all servers, and if user $u$ is assigned to group $g$, then $$q_{u}=\frac{\sum_{s\in\mathcal{S}_{g}}h_{us}}{\sum_{s\notin\mathcal{S}_{g}}h_{us}}.$$Note that the service quality for user $u$ depends only on which servers are/are not in the same group with it; the assignments of other users do not influence the value of $q_u$.


An answer to the OR SE post explains how to model this as a mixed-integer linear program, including how to linearize the objective. That is the approach I would recommend. The original poster, however, specifically asked for a heuristic approach. I got curious and wrote a genetic algorithm for it, in R, using the GA library. Since this is a constrained problem, I used a random key GA formulation. I won't go into excessive detail here, but the gist is as follows. We focus on assigning servers to groups. Once we have a server assignment, we simply compute the $q_u$ value for each user and each possible group, and assign the user to the group that gives the highest $q_u$ value.


To assign servers to groups, we start with an "alphabet" consisting of the indices $1,\dots,S$ for the servers and $G$ dividers (which I will denote here as "|"). In the R code, I use NA for the dividers. A "chromosome" is an index vector that permutes the alphabet. Without loss of generality, we can assume that the first server goes in the first group, and the last divider must come after the last group, and thus we permute only the intervening elements of the alphabet. For instance, if $S=5$ and $G=3$, the alphabet is $1,2,3,4,5,|,|,|$ and a chromosome $(2, 7, 4, 6, 5, 3)$ would translate to the list $1, 2, |, 4, |, 5, 3, |$. (Each element of the chromosome is the index of an element in the alphabet.) I would interpret that as group 1 containing servers 1 and 2, group 2 containing server 4, and group 3 containing servers 3 and 5.


There is no guarantee that a random chromosome produces a server grouping that contains at least 1 and at most $M$ servers in every group, so we post-process it by going group by group and adjusting the dividers by the minimum amount necessary to make the current group legal. Once we have the servers grouped, we assign users by brute force and compute an overall fitness of the solution.


I am deliberately leaving out some (OK, many) gory details here. My R code and a test problem are contained in an R notebook that you are welcome to peruse. When I rerun the GA on the same test problem, I get different results, which is not surprising since the GA is a heuristic and is most definitely not guaranteed to produce an optimal solution. Whether the solution is "good enough", and whether it scales to the size problem the original poster has in mind, are open questions.