This post continues my previous post about approximate equality of some value across multiple entities. The motivation was a question
posed on OR Stack Exchange asking how to partition $M$ machines into $G$ groups so that each group would have
approximately the same total productivity. The machines have
specified productivity values $P_1,\dots,P_M \ge 0$, and the productivity of a group is just the sum of the productivity values of the group members. The question assumes that $G$ divides $M$ evenly, so that each group has the number $S = M / G$ of members.
The previous post covered the issue of what metric to use in the objective function. Here I will focus on what algorithm/heuristic to use to solve it.
The author of the question specified $M=21$, $G=7$, $S=3$ for problem dimensions, with productivity values $P_m \in [0,10].$ He also posed a heuristic that on the surface makes sense: assign machines sequentially (I assume in decreasing productivity order) to the group with lowest current productivity (and with space to accept another machine). A genetic algorithm with chromosomes representing permutations of $1,\dots,M$ can be applied to any of the objective functions. (Since GAs maximize fitness and the problem here is to minimize the dispersion measure, we would just maximize the difference between the dispersion measure and some fixed upper bound on it.)Finally, we can find exact solutions using a mixed integer linear program and any objective except MSD. (The MSD would be a mixed integer quadratic program.) The MIP models would contain variables $x_{mg}\in \lbrace 0,1 \rbrace$ for each machine $m$ and group $g$, indicating membership of that machine in that group. They would also contain auxiliary variables $y_g \ge 0$ to indicate the productivity value for each group $g$. The common part of the models would involve constraints $$\sum_{g=1}^G x_{mg} = 1\quad\forall m$$ (every machine is assigned to exactly one group), $$\sum_{m=1}^M x_{mg} = S \quad\forall g$$ (every group contains $S$ machines) and $$y_g = \sum_{m=1}^M P_m x_{mg} \quad\forall g$$ (defining the group productivity variables in terms of the assignments). To minimize the range, we would add variables $z_0, z_1 \ge 0$ plus constraints $$z_0 \le y_g \quad\forall g$$ and $$z_1 \ge y_g \quad \forall g$$ and then minimize $z_1 - z_0$. To minimize the MAD, we would instead add variables $z_g \ge 0$ for $g=1,\dots,G$ with the constraints $$ z_g \ge y_g - S\cdot \overline{P} \quad\forall g$$ and $$z_g \ge S\cdot \overline{P} - y_g \quad\forall g$$ (where $\overline{P} = (\sum_m P_m)/M$ is the mean productivity level of the machines, so that $S\cdot \overline{P}$ is the mean productivity per group regardless of how the groups are formed). The objective would then be to minimize $\sum_g z_g$.
I decided to code some of the alternatives in R (using CPLEX to solve the MIPs) and see how they did. The author's heuristic has the advantage of being very fast. The MIP models, not surprisingly, were much slower. I tried adding some antisymmetry constraints (since the objective value is unaffected if you permute the indices of the groups), but they did not seem to help run time, so I dropped them.
Here are the range and MAD values achieved by each method on a particular test run (reasonably representative of other runs).
Method Criterion Range % Gap MAD % Gap
Author None 381.02613 564.734106
GA Range 52.04068 49.728175
GA MAD 56.95300 66.916019
MIP Range 0.00000 2.215414
MIP MAD 17.02795 0.000000
The gap measures are percentage above optimal. The author's method seems to be suboptimal by a wide margin, and the GAs are not doing particularly well on this example either.
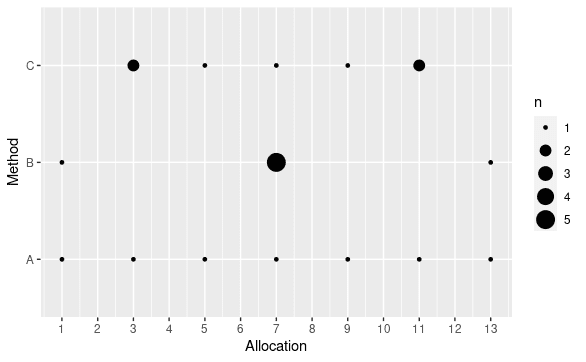
We can visualize the group productivity levels for each solution in a bubble plot, where the size of a point is the productivity. The actual group productivity levels are close enough to each other that the plot is not helpful, so rather than plotting productivity I will plot the absolute percentage deviation from the overall mean productivity of all groups.

For the author's heuristic, group 3 has a productivity level close to the target mean and the other groups are pretty far off. (Remember that this is absolute deviation, so while we know group 1 for the author's solution is way off, we do not know from the plot whether it is above or below mean.) The MIP model that minimizes range looks the best to me, even though the MIP model that minimizes MAD is better with respect to overall absolute deviation.
There are three caveats to bear in mind. First, this is one test run, with randomly generated data. Altering the data affects all the results, although in multiple runs the author's heuristic always had gaps of 200% or more and the GAs never found optimal solutions. Second, performance of the GAs is affected by multiple parameters, in particular the population size and number of generations run. Third, we could adapt the author's heuristic by using the $G$ machines with highest productivity as "anchors" for the $G$ groups and then assigning the remaining machines in random order rather than in decreasing productivity order. That would allow us to run the heuristic multiple times with different sort orders for the machines, subject to time and/or iteration limits, and pick the best solution found.
My R notebook is available for download. Fair warning: it requires a bunch of packages, and requires a CPLEX installation if you plan to run the MIP models.