A question posed on OR Stack Exchange asked how to partition $M$ machines with specified productivity values $P_1,\dots,P_M \ge 0$ into $G$ groups of $S$ machines each (where $G\cdot S = M$) so that each group would have approximately the same total productivity. This raises an interesting question about how one quantifies "approximate equality".
Some of the suggestions for metrics among the responses to the question included minimizing the maximum productivity of any group, maximizing the minimum productivity of any group, and minimizing the range (the difference between the maximum and minimum). I suspect that mathematical convenience at least partly motivated them, since they are all easy to incorporate in an optimization model. Of those three, minimizing the range would get my vote. At the same time, minimizing the range does not minimize the "lumpiness" of the distribution of values between the extremes. So I would also consider minimizing either the mean absolute deviation (MAD) or mean squared deviation (MSD) for the group productivity values, recognizing that either of those might result in a greater overall spread of group values.
At this point I will drop any references to machines and productivity and just look at the general problem of allocating a fixed amount of something to a fixed number of somethings. Let's suppose that I have 49 units of whatever and 7 entities to whom to distribute it. The mean number of units given to any entity will be 49 / 7 = 7, regardless of how I do the allocating. Consider the following plot showing three different possibilities.
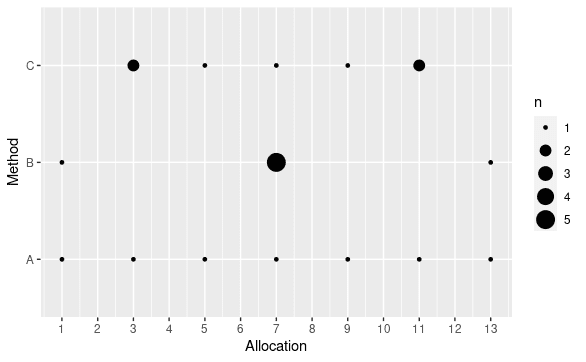
The size of each bubble is the number of entities receiving an allocation of a given size. True equality would manifest as one large bubble at value 7.
Methods A and B have the same minimum and maximum (and hence the same range), but method B is clearly more concentrated (smaller MAD and MSD). I suspect that the author of the original question would prefer B to A. On the other hand, if we are allocating rewards to people, someone might possibly find A more egalitarian, in that the recipient of the smallest amount (1) is less disadvantaged relative to the recipient(s) of the second smallest amount (3 in A, 7 in B), and similarly the recipient of the largest amount (13) is less advantaged relative to the recipient(s) of the second largest amount (11 in A, 7 in B).
Now compare methods B and C. C has a larger minimum, smaller maximum and smaller range, but B has a smaller MAD. (They have the same MSD.) Which is closer to equality? I think that is a subjective question. In my next post, I will compare a few possible solutions to the original question.
My point here is that minimizing range and minimizing MAD are both valid choices, potentially leading to substantially different solutions.
No comments:
Post a Comment
Due to intermittent spamming, comments are being moderated. If this is your first time commenting on the blog, please read the Ground Rules for Comments. In particular, if you want to ask an operations research-related question not relevant to this post, consider asking it on Operations Research Stack Exchange.